
Spotify collects a lot of data about what we listen to. I used Power BI to find out what I could learn about my music preferences by analysing my Spotify data.
Most streaming services provide a way for you to download the data they keep for you. Spotify provides your data to you on request, although it can take a few weeks for them to process it.
So I put in a request for my data to see what I could find out about my music habits over the last three years.
Using Power BI, Microsoft’s business intelligence tool, and taking advantage of the free Spotify API, I put together a detailed report into my last three years of streaming history. That’s data from over 3,000 hours of listening to over 7,000 songs from 2600 artists.
Contents
Spotify Power BI
What I found
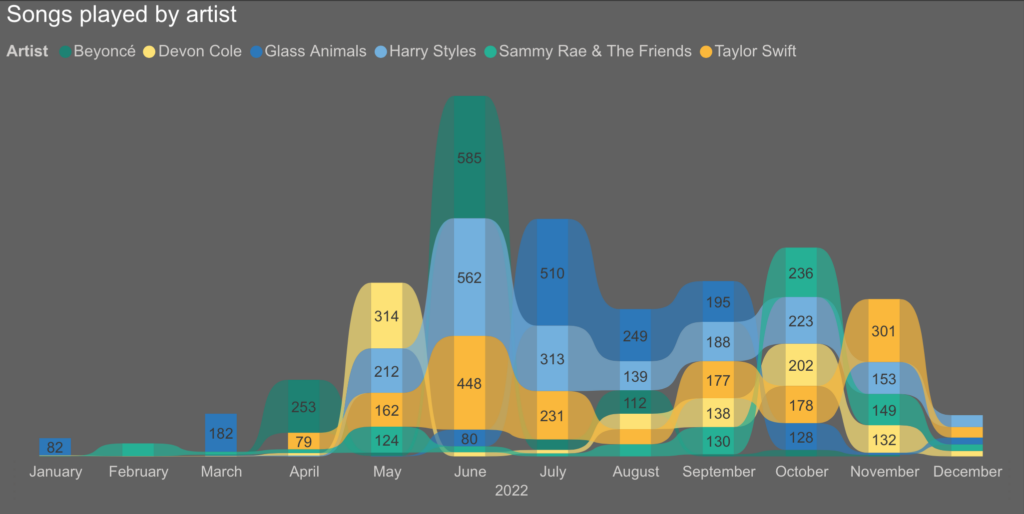
I didn’t realise I was such a Harry Styles fan! I’ve spent the equivalent of five days listening to Harry. I’m putting this down to getting into Fine Line late and then getting way into Harry’s House as soon as it dropped in 2022.
I also discovered that I can’t seem to stick with any artist, album or song for too long. None of my top songs, artists or album stay in the top spot for more than a year.
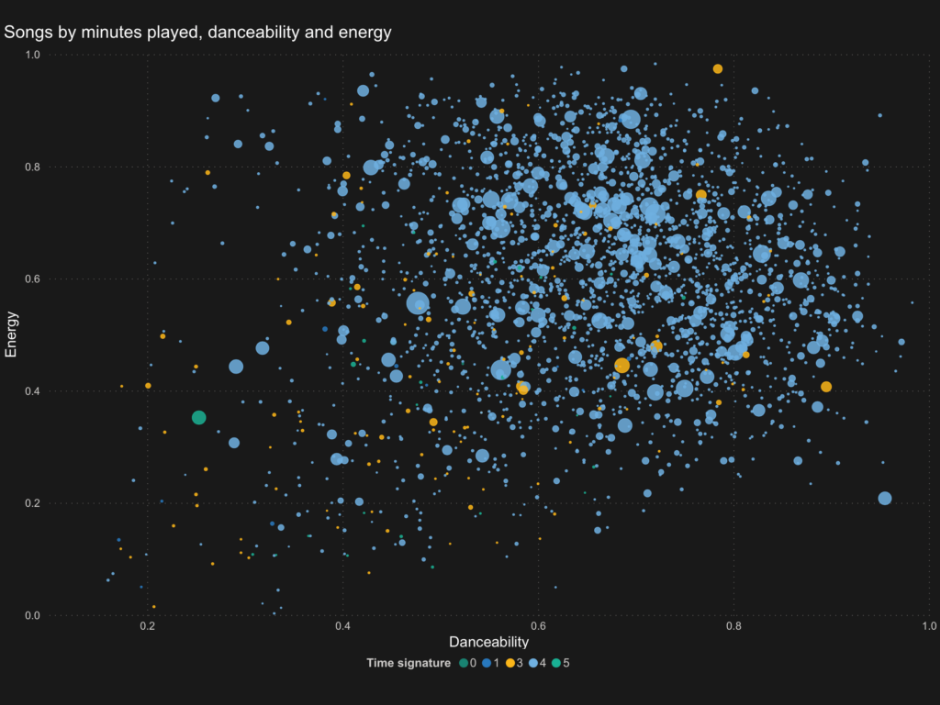
But while the songs may change, the type of song doesn’t vary much at all. Thanks to Spotify’s API, I processed audio feature for every song that I streamed. This provides information on the danciness, energy levels, tempo and much more data for each song.
Analysing that data showed that I like songs that are danceable, high energy and positive. My preferences also don’t change much over time.
How it works
Spotify provides the data in several JSON files. Those files contain a lot of different types of data, but I was only interested in my streaming history.
I used Power Query M in Power BI to transform the streaming history JSON files into a tabular format. Each track played includes a name, artist, album and a unique Spotify identifier to identify it.
As always, the data is never as clean as you expect it to be. Some plays were missing their unique identifiers and the most recent data came in a different format to the extended data.
Luckily, Spotify provide their REST API for free, which I could take advantage of to overcome some of these limitations. For the plays without unique IDs, I removed all duplicates and queried the database to retrieve their unique ID.
I wrote Power Query M functions to use the API to:
- Retrieve the unique ID for songs without them, by searching by title, artist and album
- Retrieve song information from the unique ID
- Retrieve audio features from the unique ID
You can find all these functions in my Github repository. I used Ken Puls’ blog to help create a function to retrieve an OAuth token from Spotify. This method isn’t perfect and you need to be careful not to expose your API secret in the file when you share it.
While Spotify’s API is free, it does have a rate limit. Sending it one query for every single song in the entire database would hit this limit and be inefficient. Instead, I grouped the songs into blocks of less than 50 songs. This enabled me to send a request for several tracks information at once, reducing the queries to the API from 5000+ to around 100. I used the same trick to then retrieve each song’s audio features.
Data analytics
Once the data modelling was complete, it was time to get to work analysing and visualising the data. I began with basic analytics, such as time spent listening in minutes, hours and days.
Calculating a value for number of plays for each song is slightly harder and requires a bit of a judgement call. Does listening to a song for 30 seconds count as a play? What if that song is only 30 seconds long? I decided to count any listen that is above one minute as a song played, although this does exclude sub one minute long songs.
I also enabled What-If parameters to allow end-users to customise the report. On the second page, viewers can select the number of favourite artists to display from one to twenty. Measures in the report then dynamically change the number of favourites they display.
To do this, I used the RANKX function and SWITCH to ensure that even if no number was selected, a value would be returned. You can see the DAX code below.
Plays by top x artist =
VAR NumberOfArtists = SELECTEDVALUE('Top N to Display'[Top number to display], 6)
RETURN
SWITCH(
    TRUE(),
    CALCULATE(
        // Calculates a ranking of all artists by plays
        RANKX(
            ALLSELECTED('Artists'),
            [Plays]
            ) <= NumberOfArtists,
        // Ensures that the context for the ranking is filtered by year only, to stop function from calculating top X artists per month, day etc
       ALLEXCEPT('Date','Date'[Year])),
    [Plays]
)
What’s next?
I’ve only scrapped the surface of the insights that you can gather from this data. I’m hoping to do more analysis on it in the future.
In the meantime, enjoy having a sticky-beak at my listening habits. If you find something interesting, let me know!
FAQs
I’m getting a Formula.Firewall error when querying the Spotify API. How can I resolve this?
I’ve had some reports of people coming up against the Formula.Firewall error when working with this dataset. The error looks like this:
Formula.Firewall: Query 'query' (step 'step') references other queries or steps and so may not directly access a data source. Please rebuild this data combination.I’ve written a blog post that outlines what this error is and how to resolve it here!